
All content teams, whether a team of one or a team of teams pushing out content every day, are asking the same question—how am I doing?
You know your internal metrics. How this week’s post compares to the week before. Whether your pageviews are growing each month. Whether or not you’re getting organic traction.
But you don’t know how your content marketing compares with other companies in your industry or the SaaS space as a whole. Are you growing alongside everyone else, outpacing them, or falling behind?
The 2020 Animalz Benchmark Report will help you answer those questions. Here’s our CEO, Devin, to introduce it:
We’ve analyzed 150,000,000 pageviews from dozens of SaaS companies to give you benchmarks to better understand your performance. We’ve also taken a look at the outliers—top-performing blogs and articles—to show you what it takes to achieve high traffic and high growth.The other thing you’ll get in our report is… even more questions. For every data point we looked at, we thought of two more we should be analyzing or relationships we should continue to explore. And explore we will, because this is the first of a new series of regular benchmark reports.Lastly, this year has been exceptional in every way. The impact of COVID-19 has reverberated around the world, and content marketing wasn’t immune. In a year when marketing—rightfully—took a backseat for many companies, our research uncovered a wealth of positive growth and inspiring success.
Navigation
🔗 Linking
✍️ What the Data Suggests
Most benchmark studies start and end with the data. Readers are left wondering, “But what do I do with it?”
Our team of content marketing practitioners is modifying our strategy and thinking about content differently as a result of the data in this report. You should, too.
Use the BLUF principle to deliver value within the first 400 words of every article. 1
If traffic is your #1 priority, focus on organic search. 2
For small blogs, use social, email, and community distribution to seed your organic growth. 3
Backlinks don’t happen by accident, so dedicate resources directly to creating “linkable” content. 4
Create tutorial content—it’s the best source of organic traffic and engagement. 5
Once the traffic starts coming in, take pains to surface relevant next-steps for your highest organic traffic content. 6
Replicate your highest-performing content over and over for a chance at the “1-million” club. 7
Build a dedicated internal linking process to earn an edge over your competitors. 8
If you’re marketing for a SaaS company that offers customer support, productivity, or ecommerce products, double-down on content. 9
If you’re marketing for a SaaS company that offers sales, marketing, and dev tools, get creative with your content. 10
📊 Where We Got Our Data
This research is based on 150 million pageviews of data from September 2019 through to August 2020, inclusive.All of the blogs in this dataset are written for a SaaS audience. Most blogs are by SaaS companies, though some—like the Animalz blog—are created for people working in the SaaS industry. The overwhelming majority of blogs featured are from B2B companies. Where we’ve featured seemingly B2C industries like “ecommerce,” we’re referring to SaaS companies that sell to ecommerce companies.We grouped blogs into five cohorts based on the traffic they generated in September 2019:
<10k pageviews
10k-50k pageviews
50k-100k pageviews
100k-1M pageviews
1M+ pageviews
Monthly growth rates are the Compound Monthly Growth Rate for the year. Yearly growth rates are the year-over-year gain in traffic. Internal links were taken from the text body of each post in the blog. Pagination, category, and author pages weren’t included, nor were links in the header or footer of a page.Though benchmarks are useful, the most useful takeaways come from outliers—the companies that beat the average and delivered remarkable results. So, we’ve called out examples of exceptionally high-performing blogs and content throughout the report as well.
🌱 Growth Channels
Key Statistics 59.22% of total traffic came from organic search. Organic search traffic grew by 9.01% per month. 18.51% of total traffic came from direct. Direct traffic grew by 7.29% per month. 12.71% of total traffic came from referral. Referral traffic grew by 4.64% per month. 3.48% of total traffic came from email. Email traffic grew by 0.36% per month. 1.96% of total traffic came from social. Social traffic declined by 17.12% per month.
59.22% of All Blog Traffic Came from Organic Search
2 Simply put: organic search is how blogs grow. Almost 60% of all traffic to the blogs in our dataset came from organic search. Direct and referral duke it out for a distant second place, with social and email bringing up the rear.
Source Traffic Share Organic 59.22% Direct 18.51% Referral 12.71% Social 1.96% Email 3.48%
Despite many of the companies in our dataset managing huge and successful social accounts and mailing lists, organic utterly dwarfs every other source of traffic.Inconsistent attribution is likely to have played a role (like “social” traffic not always showing up as “social”), but the magnitude of variance between these channels paints a clear picture: focus on other channels at the expense of organic, and you are always going to struggle to grow.The reason is simple. Organic is the only channel that compounds. Effort today will reliably result in more traffic next week, next month, next year, and years after that. Compare that to a social channel like Twitter, where the half-life of a post might be as little as 18 minutes. The ephemerality of social traffic, and even email traffic, means they aren’t sustainable channels for growth.
Small Blogs Get Just 48% of their Traffic from Organic
3 But the prevalence of organic search doesn’t mean that all other sources are worthless. In fact, particularly in the early stages of a blog, traffic coming from other sources is vital. Below, we break down the traffic share by blog size using the traffic each blog generated in September 2019.
Blog Size (Monthly Pageviews, September 2019) Organic Direct Referral Social Email <10k 48.03% 23.42% 15.67% 2.31% 3.19% 10k-50k 60.68% 17.03% 13.95% 2.23% 2.44% 50-100k 72.11% 12.11% 7.32% 0.99% 6.06% 100k-1M 74.98% 14.78% 8.16% 1.49% 1.73% 1M+ 64.51% 9.37% 4.83% 0.83% 17.82%
If you are a small blog getting fewer than 10,000 pageviews a month, organic might account for less than half of your entire traffic—far less than the 60-70% average found on other blogs. Instead, more traffic comes from:
Direct. When Google Analytics doesn’t know the traffic source, it calls the source “direct.” It could be someone directly typing the URL in the address bar, a misconfiguration of your tracking parameters or redirects, or a link from “dark social,” such as Slack, Discord, or WhatsApp. In our dataset, almost a quarter (23.42%) of traffic to smaller blogs came from direct sources.
Referral. Referral visitors come from your backlinks. Content marketers sometimes tend to think about backlinks only as a way to increase organic ranking. But actual people are actually clicking on those actual links and coming to read your articles. 15.67% of readers come through a link like this for small blogs.
Our data shows that new blogs often struggle with organic traffic. Usually, this can be traced to the lack of domain authority required to successfully contest most mid- to high-volume keywords.In the early days, smaller blogs can overcome this hurdle by focusing on movement-first content: sharing original perspectives and experiences to establish credibility with your target audience. This content harnesses non-search distribution channels, like Slack groups and other online communities, to “seed” the early backlinks required to gain traction in search.
With the exception of an outlier in the 1M+ category, social and email sources never make up double-digit contributions to blog traffic. But, again, that doesn’t mean they are unimportant. Your social followers and email subscribers are some of your most fervent fans and will be the ones creating backlinks that lead to referral traffic that lead to organic traffic.
Organic Search Was the Fastest-Growing Channel
In addition to accounting for the vast majority of total traffic, organic search also saw the highest growth rate, increasing by 9% every month. As before, we found direct and referral in second place—growing at 7.3% and 4.6%, respectively—with email and social growing the slowest (in the case of social, even shrinking).
Source Mean CMGR Organic 9.01% Direct 7.29% Referral 4.64% Social -17.12% Email 0.36%
CMGR is the compounding monthly growth rate, kind of like the compound interest of your blog—how much it is growing on top of itself each month. Even seemingly small CMGRs lead to large year-over-year traffic changes. Case in point: a 9.01% CMGR would 2.5X your organic traffic over a single year.Every single one of our size segments saw organic growth over the year:
Blog Size (Monthly Pageviews, September 2019) Median Organic CMGR <10k 8.13% 10k-50k 2.57% 50-100k 1.15% 100k-1M 0.11% 1M+ 3.54%
The fact that the highest growth rate came from the smallest blogs is understandable: it’s easier to grow X% of 1,000 than X% of 100,000. But again, these small growth rates build to large yearly changes. The companies in the largest-traffic bucket, those starting with more than 1 million pageviews per month, grew at 3.54% each month. With that growth rate, a blog starting right on the cusp of 1 million pageviews would have almost 500,000 more a year later.
Follow-up Questions
How do non-organic sources of traffic grow a blog?
By how much did social traffic really drop?
How much social and email traffic goes misattributed in Google Analytics?
🚦 Traffic Benchmarks
Key Statistics The median SaaS blog generates 16,969 monthly pageviews. 80% of all blog traffic is generated by just 16% of blogs. Blogs starting from fewer than <10k monthly pageviews averaged 3,764 monthly pageviews. Blogs starting from 10k-50k monthly pageviews averaged 26,935 monthly pageviews. Blogs starting from 50-100k pageviews averaged 78,714 monthly pageviews. Blogs starting from 100k-1M monthly pageviews averaged 223,127 monthly pageviews. Blogs starting from 1M+ monthlypageviews averaged 3,384,024 monthly pageviews.
The Median SaaS Blog Generated 16,969 Monthly Pageviews
There is no such thing as an average SaaS blog. Some only started publishing content this year—a few thousand pageviews are a win. Some realized the potential of content years ago and have been using the compounding effect to build a content empire. They expect hundreds of thousands of readers each month.Now, our data is skewed by some extremely well-performing blogs. So, it showed that the “average” SaaS blog averaged 2,197,353 pageviews in the past year. Assuming an even monthly split, that’s 183,113 pageviews per month. Wow.That’s why we are focusing instead on the median number (a central statistic less sensitive to outliers) instead of the mean number. The median number of yearly pageviews per blog was 203,623. Divided by 12, that’s a monthly average of 16,969 pageviews.We can see the skewness if we plot out a power curve of total traffic by blog:
Traffic Followed a Pareto Distribution
Also known as the 80/20 rule, the Pareto principle states that “80% of consequences come from 20% of the causes.” According to our data, ~80% of all the traffic comes from 16% of all the blogs.A huge number of natural phenomena follow the 80/20 rule. Classic examples include 80% of Italy’s land being owned by 20% of the population and 80% of a farm’s yield coming from 20% of its most productive plants. In many businesses, the minority of the largest customers account for the majority of your revenue.The 80/20 rule acknowledges that every blog is likely to have a handful of outliers that generate most of the blog’s traffic. Learn from these articles, and nudge the direction of your marketing towards these proven high-performers. As we explain below, replicating the success of your best-performing content is the key to joining the 1 million pageview club.
Small (<10k) Blogs Averaged 3,764 Monthly Pageviews
To see how the lower-trafficked sites are performing, we need to tease apart the blogs that see only a few hundred visitors a month from those visited by hundreds of people an hour.Our smallest cohort started the analysis timeframe (Sept 2019—August 2020) with fewer than 10,000 pageviews in September 2019. Here is a boxplot for that cohort:
Boxplots allow us to see the entire range of the data as well as the central statistics. Each box consists of:
The minimum value in the segmented dataset
The first quartile value (the value that appears 25% of the way through the dataset)
The median value
The third quartile value (the value that appears 75% of the way through the dataset)
The maximum value in the dataset
The median total pageviews for this cohort was 45,162, or 3,764 per month. But what’s more important are the outliers at or near the maximum in this cohort. These are blogs that started in September 2019 with fewer than 10,000 pageviews per month but still managed to acquire over 200,000 pageviews in total.The median growth rate in this cohort was 5.92%, but the top-growing blog saw a 68.66% compound monthly growth rate:
If you’re hitting high growth rates with a small blog, you should be happy with the progress—it means you are getting that foothold in organic traffic.Email productivity tool FollowUp.cc is a great example in this bucket: their blog traffic grew 14X from September 2019 to August 2020. Most of this growth came from the organic growth of a single article, 6 Ways to Send a Polite Reminder Email. Despite being six years old, a huge surge in interest and keyword rankings during the budget freezes and held payments of the early pandemic period propelled this article—and the blog as a whole—to new heights.
Different-Sized Blogs Grew at Different Rates
The table below shows how average yearly and monthly traffic varies by blog size. As you’d expect, the bigger the blog (in terms of total yearly pageviews), the greater the traffic in the following year.
Blog Size (Monthly Pageviews, September 2019) Median Monthly <10k 45162 3763.5 10k-50k 323215 26934.6 50k-100k 944565 78713.8 100k-1M 2677518 223126.5 1M+ 40608290.5 3384024.2
Many traffic benchmarks tout a single catch-call growth rate or traffic figure. However, given the huge variance in the figures shown above, it makes more sense for companies to compare themselves to blogs of a similar size:
A relatively small blog (<10k monthly pageviews) is likely to stay “on pace” with similar blogs if it can sustain an average of 3,674 monthly pageviews.
A more established blog (10k-50k) has a higher bar to clear, needing an average of 26,935 monthly pageviews.
The next step-up comes by way of blogs in the 50k-100k range. Here, a good traffic goal is 78,714 monthly pageviews.
Big, established blogs (100k-1M) should target traffic in the region of 223,127 monthly pageviews.
The handful of elite blogs with over 1M pageviews can “keep up” with their peers if they hit 3,384,024 monthly pageviews (wow).
The majority of these blogs closed out the year with more traffic than the previous year, which is another hallmark of organic growth. Most SaaS blogs get their traffic from organic search, and the compounding nature of search means that most blogs can expect year-on-year traffic growth.
Bigger Blogs Had Less Stable Growth
In the mid-tier cohorts, total pageviews are unsurprising—for example, most blogs in the 50k-100k range (getting 50k-100k PVs/month at the start of the sample) didn’t get more than 1.2 million pageviews during the course of the year (that is, 12x the top of that range).
Interestingly, the growth rates for these cohorts don’t paint such a rosy picture:
All three cohorts have positive median compound monthly growth rates (CMGRs)…
10k-50k: 0.42% CMGR
50k-100k: 1.16% CMGR
100k-1M: 0.35% CMGR
…but there are also obviously negative growth rates for some blogs in the 10k-50k and 100k-1M pageview cohorts. We’ll discuss these more extensively in a later section, but in a nutshell: these are blogs in verticals that have been negatively impacted by the COVID-19 pandemic.
Massive Blogs Have an ‘Escape Velocity’
Here is a boxplot of total traffic for each of our cohorts alongside the 1 million-plus cohort:
This echoes the “power curve” we mentioned at the beginning of this section. In the smaller cohorts, where 80-90% of blogs reside, growth from cohort to cohort is linear. But there seems to be an “escape velocity” once you hit 1M pageviews/month. The growth rate here was 3.89%, almost as large as the smallest cohort. It is extremely difficult to get to this scale—you need not just great content but also a large market, great product, and well-known brand. But when you do, whatever you are doing resonates perfectly with your audience.This is where content marketing, if it’s ever possible, becomes “easy.” These 1M pageview blogs have refined their messaging, persona targeting, and strategy over thousands of blog posts and developed a clear picture of what works. It’s a costly, time-intensive exercise years in the making, but it means that every subsequent article has a higher chance of high performance, care of brand recognition, domain authority, and a deep understanding of their audience’s needs. This is where real content marketing moats are built.
Follow-up Question s
What is the tipping point for this escape velocity?
Are there different escape velocities for different verticals?
Is there a repeatable process for getting these types of numbers?
🐋 The 1 Million Club
Key Statistics Blogs with over 1 million yearly pageviews generate 86.52% of their traffic from organic search. It takes a median of 9 years to reach 1 million yearly pageviews. Blogs with over 1 million yearly pageviews had a median of six posts with greater than 100k yearly pageviews.
The 1 Million Club Got 87% of Traffic from Organic Search
7 We likely all aspire to join the “1 million yearly pageviews” club, so we analyzed our most successful blogs to better understand the hallmarks of behemoth sites. There were three common attributes among the blogs we analyzed:
Extremely high organic traffic share. The median percentage of organic traffic for blogs with over 1 million yearly pageviews was 86.52%, significantly higher than the average of 59.22% for all blogs. The highest was 96.6% of all traffic coming from organic search. Ultra-high traffic is almost entirely a product of organic search.
Decade-long consistency. The median age of the blogs in the 1 million club was nine years (the mean was 10). The youngest company in this cohort was five years old, with most founded at least a decade ago. Though not all started publishing content when they were founded, they have all been publishing for a long time and have large brands to grow on.
Multiple 100k+ pageview posts. Each of the blogs in this cohort had at least one article that generated more than 100,000 pageviews in the past year. The median number of 100k posts was six (the mean was 16, skewed by super-high performers).
We can see how multiple 100k+ pageview posts are correlated with success if we open up our timeframe to the total lifetime view of a blog. If we plot total lifetime pageviews on an x-axis against the number of posts with more than 100,000 pageviews on the y-axis, we get an obvious scatterplot:
It makes sense that more 100k posts add up to higher total pageviews. But the data also highlights that the biggest blogs don’t grow through one huge post or through a thousand small posts. Ultra-successful blogs have taken the time to learn exactly what their audience needs, resulting in a large foundation of high-performing content.The scatterplot also shows a step change between the just “great” blogs and the “really great” blogs. Those that have more than 10M+ total lifetime pageviews also have double-digit 100k+ posts. These are the sites that have truly nailed their audience and their content. They are consistently getting huge volumes of traffic.So what do these articles look like? Here’s one from AdEspresso: Top Instagram Updates in 2020 – September Edition.

Forget the title—this was actually launched in 2016. It has well over 2 million lifetime pageviews and generated 36 times more views in the most recent month than in its first month. AdEspresso has dozens of such articles.There’s a lot to be learned from AdEspresso’s strategy, and we’ve written at length about their propensity to generate 100k view blog posts and the team’s use of content marketing to ride the wave of growth that followed from the advent of social media advertising.
Follow-up Questions
What makes the ideal 100k+ post?
Is there any way to quicken the process to 1,000,000 pageviews?
How do the conversion rates of 1M+ blogs compare to smaller blogs?
📈 Industry Growth Rates
Key Statistics Customer Success/Support saw average traffic growth of 383.29%. Productivity/Project Management saw average traffic growth of 226.13%. Ecommerce saw average traffic growth of 189.95%. EdTech saw average traffic growth of 71.30%. Business saw average traffic growth of 55.38%. Fintech saw average traffic growth of 36.12%. Dev/Analytics saw average traffic growth of 31.12%. Marketing saw average traffic growth of 27.40%. Sales saw average traffic growth of 9.89%.
COVID Impacted Ecommerce for the Better
This year is unlike any other in recent memory. The way life was lived at the start of our dataset in September 2019 is not how it was lived at the end in August 2020.9 Perhaps no industry saw such a dramatic change as ecommerce. As more and more shopping moved online, the services and software underpinning ecommerce also saw growth. And we can see that in content.
Mean Traffic Ecommerce 11030084 Business 9016207 Marketing 2717368 Dev/Analytics 1093652 Fintech 638048 Customer Success/Support 522682 Productivity/Project Management 490705 Sales 435618 EdTech 41130
From our dataset, mean traffic per blog was the highest in the ecommerce vertical. Blogs in this vertical saw an average of over 11 million pageviews over the past year—almost 1 million per month.As this slide from Benedict Evans shows, online retailers saw a radical surge in market penetration as a direct result of COVID-19. With increased interest came increased search volume and blog traffic. As retailers shifted online, they had to learn about an entirely new way of selling. The best place to learn is on the blogs of these ecommerce SaaS companies.
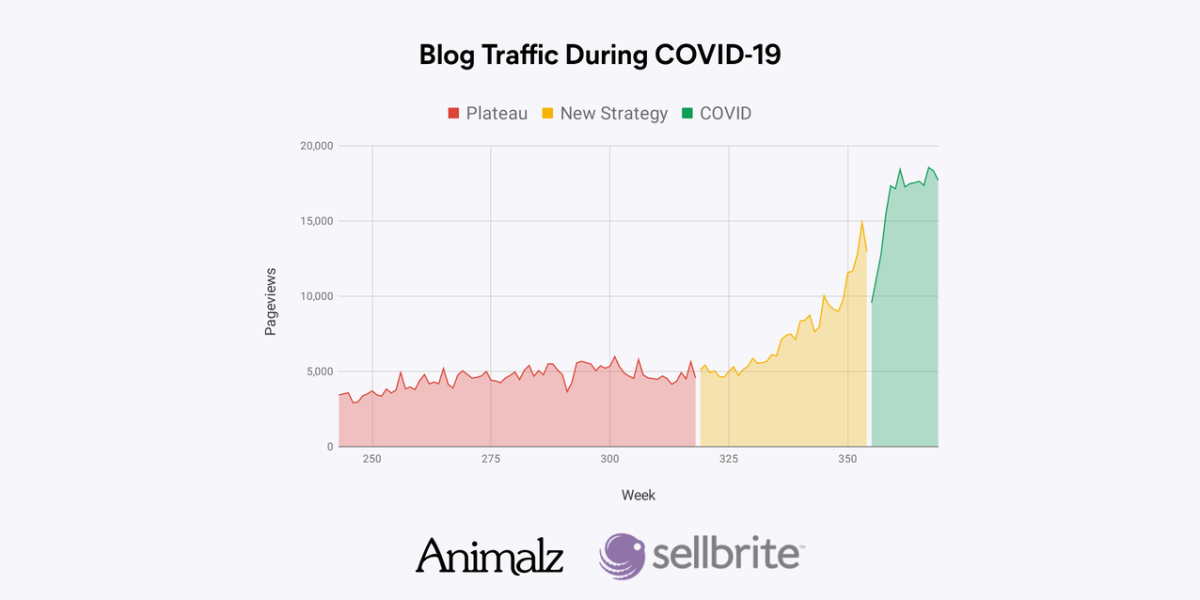
The power of content is on display: companies with ecommerce blogs were best-placed to capitalize on the surge of interest, with many companies seeing record-breaking levels of traffic growth. One example, which we’ve covered before, is Sellbrite.To quote from the article, “While Sellbrite didn’t predict the pandemic, it did ensure that it’s content marketing supported its product positioning: when demand for multichannel ecommerce was at its peak, Sellbrite was prepared with hundreds of hyper-relevant keyword rankings.”
At the other end of the scale lies educational technology companies or EdTech. This is another area that has blossomed online in the past six months, but the difference is that—while ecommerce is an established vertical with large companies—EdTech is still nascent. These small companies have come online just as they’re needed to help people continue to learn remotely.
Customer Support Grew 383%; Sales Just 10%
In terms of growth, though, EdTech was one of the highest-growing areas, with mean growth of 71.3% over the year.
Mean Growth Customer Success/Support 383.29% Productivity/Project Management 226.13% Ecommerce 189.95% EdTech 71.30% Business 55.38% Fintech 36.12% Dev/Analytics 31.12% Marketing 27.40% Sales 9.89%
10 The top and tail of this list show the differing fortunes of SaaS over the past year. At the bottom are the customer acquisition verticals, sales and marketing. As budgets shut down during COVID, fewer companies were interested in increasing sales and marketing.Instead, they pushed their effort into the vertical at the top of the list, customer success and support (coincidentally the topic of a webinar we released on April 2—Customer Retention When It Really Matters). Every dollar/pound/euro/insert currency here has been spent on keeping current customers and revenue. Ironically, this meant that customer success and support companies saw huge traffic growth.The growth of productivity and project management content tallies with the fact that the world has gone online. As companies have shifted to remote work, they need new ways to engage with their employees and understand how well they are performing. Esigning solution SignEasy is an example of this in action: their analytics reveal a marked increase in traffic just as COVID closed shopfronts and offices, and the need for online signatures skyrocketed.
Follow-up Question s
What are the underlying reasons for growth or decline in each vertical?
Will these trends continue into 2021?
Will the rapid rise of EdTech lead to significant traffic gains in the future?
📖 Engagement
Key Statistics The median bounce rate for a blog is 80.33%. The median time on page for a blog is 3 minutes and 15 seconds.
80% of Readers Left After One Article, and That’s Fine
6 The median bounce rate across the dataset was 80.33%. Put another way, four out of five readers left after just one article.This is not necessarily a bad thing. When the bulk of your traffic is driven by organic search (as our research shows), readers are coming to your site for a specific reason, not to browse. Search-focused articles are situationally useful and provide point-in-time value. There’s little incentive to click around if an article has done its job.
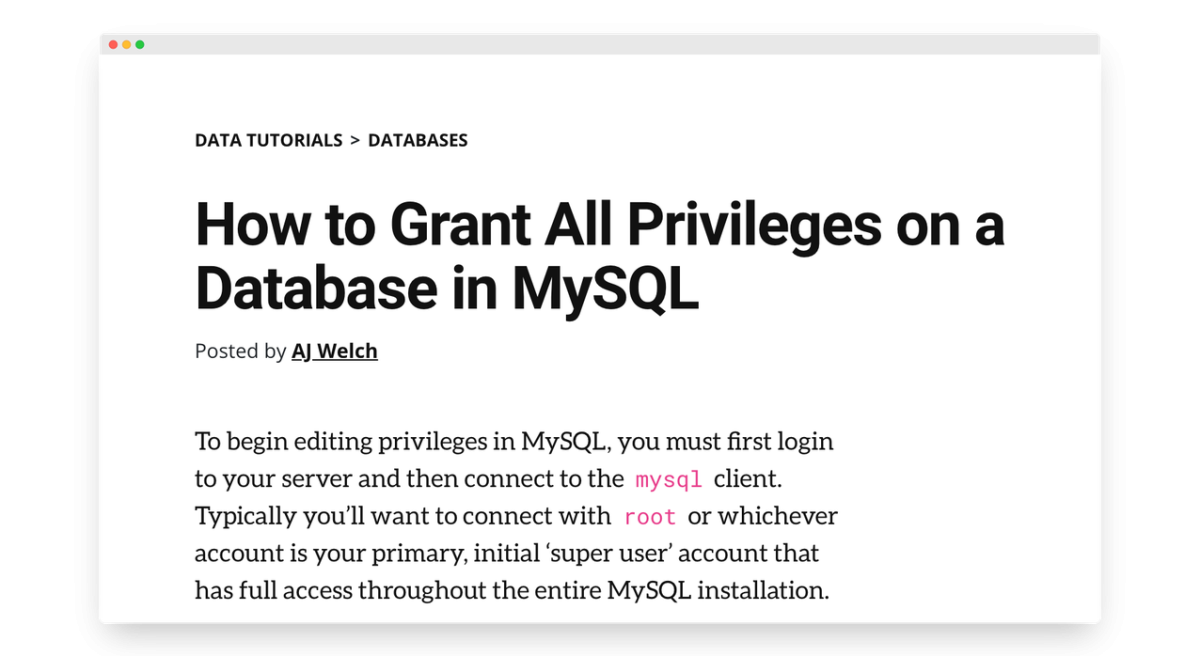
That doesn’t mean these readers won’t return in the future. Deliver value through a search-focused article, and your reader is more likely to see you as a trusted resource in the future. In future SERP shootouts, your familiar, feel-good brand is more likely to win. Sometimes, they’ll even come back via a direct URL or branded query.5 Even when you depend on organic search for your traffic, it’s still possible to persuade readers to stick around. Just ask cloud-based data analytics platform Chartio. They have an average bounce rate across their content of just 26.65%, so only one in four of their readers are heading somewhere else after reading their first article.Looking at one of their highest-trafficked and least-bouncy articles, How to Grant All Privileges on a Database in MySQL, we can see a few features that help lower bounce rates. Though the article itself doesn’t link out to other content, the structure of the page helps move people to other content. There is breadcrumb navigation at the top, so the reader knows that there is other content on the same topic and how to get to it:
At the bottom of the article, there is a list of similar content, so the reader can also easily move on to read more:
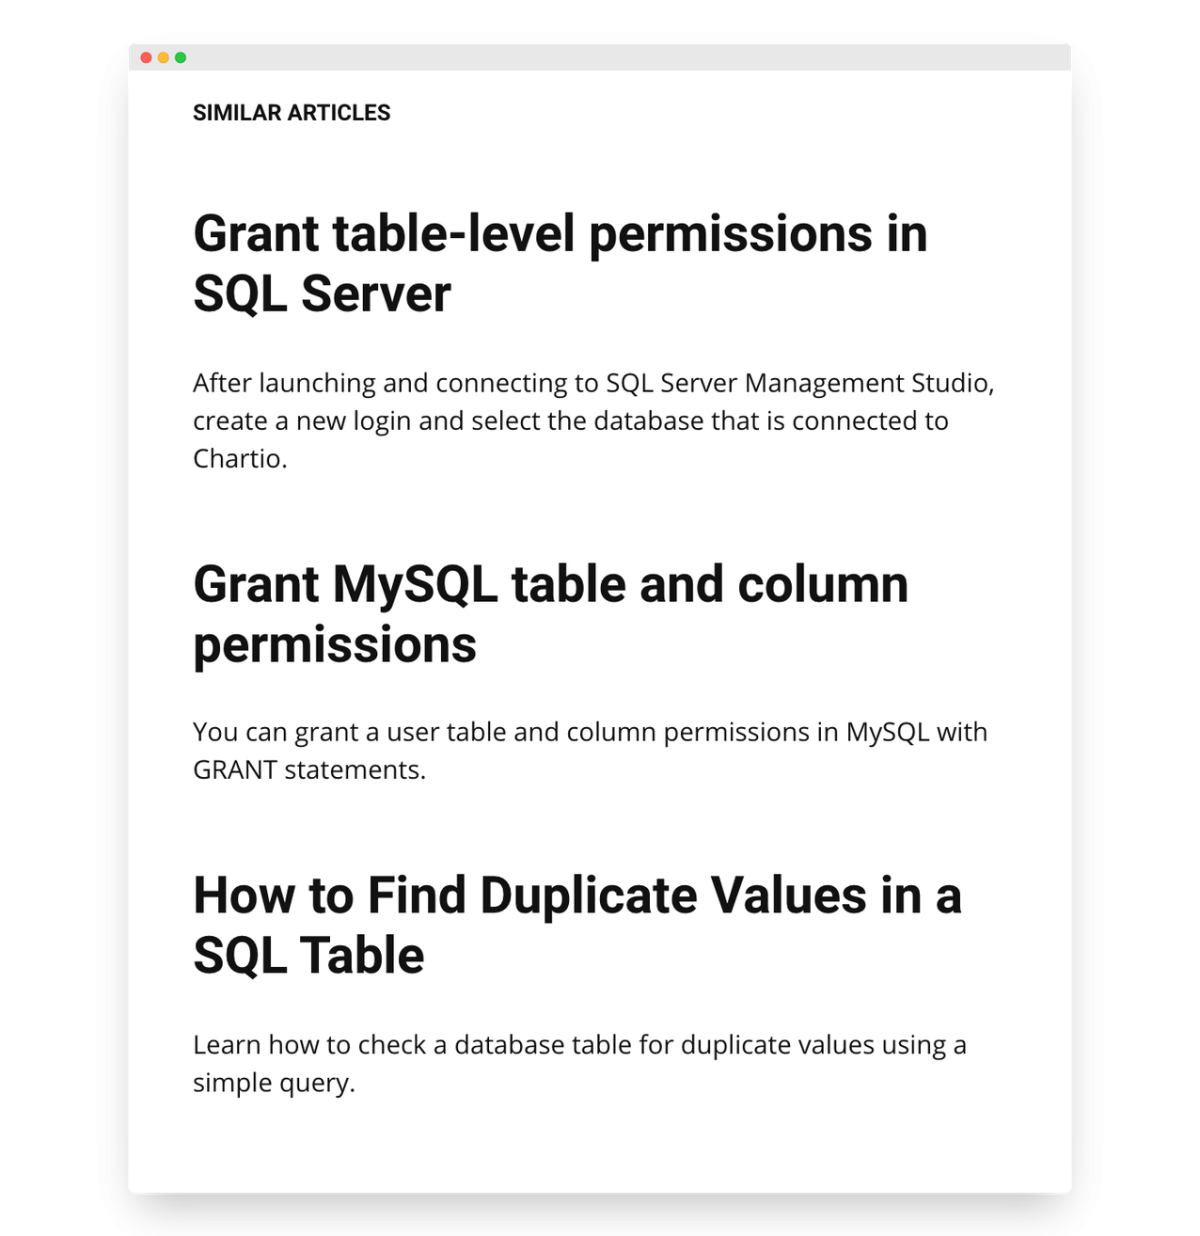
Finally, this is a technical tutorial. A reader of this specific article probably needs to know about other SQL features. These articles lend themselves to drawing people further into a site.
Median Time on Page was ~3-Minutes, or Enough Time to Read 400 Words
1 For our dataset, the median time on page is 3 minutes and 15 seconds—about as long as it takes an average reader to read 400 words. Two things could be happening here: either SaaS articles have got drastically shorter, or people aren’t reading every single word on the page.
Just like with a high bounce rate, it’s absolutely fine that readers aren’t engrossed in every single word on the page. People coming from organic search are looking for specific information. In many ways, the quicker you can give it to them, the better.We’re big believers in the importance of BLUF, or “bottom line up front.” A lot of articles bury their key point hundreds, even thousands of words down the page, either in a direct attempt to keep people around or as an indirect result of fluffy, meandering writing. Instead, stronger, more persuasive content results from opening immediately with a key point and using the bulk of the article for additional context, elaboration, and supporting evidence.Average time on page can be interpreted in two ways: we should either try to keep readers around for longer, or we should try to deliver more value in that short timeframe. BLUF is a powerful tool for making the most out of those precious three minutes.
If You Want People to Dwell, Teach
The most interesting examples come from the outliers. Case in point: the average time on page for one developer-focused blog was over 12 minutes. Readers spent over 30 minutes reading one article, a guide to building web APIs.
There’s a lot to learn from these outliers. In-depth tutorials often come in at well over 4,000 words, naturally increasing engagement. UX improvements – like sidebar menus – can help with navigation. This type of content makes it easy for readers to spend hours on a single article learning how to use a specific technology. Tutorial content increases engagement metrics, sure – but it does so by delivering a huge amount of specific, concrete value.
Follow-up Questions
Is bounce rate a function of of internal linking? If you have more links between articles, do readers visit those other pages?
Is time on page a simple function of word count? Do longer articles keep people reading for longer?
How do engagement metrics vary by channel?
🔗 Linking
Key Statistics The median number of internal links for an article is 0. The median number of external backlinks to a SaaS article is 1.
The Median Number of Internal Links was 0
8 The median number of internal links per SaaS article is 0. Over half of all the articles in the dataset didn’t link to another article on the same blog from within the text. Why? We have a few hunches:
A handful of core articles take most of the “mindshare” and get linked to disproportionately often, leaving most other articles neglected.
Multiple content teams or communication challenges cause poor awareness of content created by other people and teams.
As blogs grow, it becomes increasingly difficult to work out where new articles should link.
Content refreshing isn’t widespread, so older content is rarely linked to newer content on similar topics.
Yet “internal links matter” is the common consensus within SaaS. It’s even recommended by Google:“You may usually think about linking in terms of pointing to outside websites, but paying more attention to the anchor text used for internal links can help users and Google navigate your site better.”Without internal links, when readers want to go deeper into your content and learn more, they can’t. Sure, they can click on “blog” and find your latest content, but that might be only tangentially related to what they were reading in the first place. Relevant links in content help readers find the best articles for them.Crucially, it also helps Google find the best articles to serve them. Internal links pass page authority, and Google infers the topic of a page from all the links pointing to it: this is why hub-and-spoke models work so well. You can use long-tail keywords for the spokes and then short-tail anchor text in those spokes to the hub to tell Google that all this content is related, and the hub is the canonical text on the short-tail keyword.
Internal Linking Improves Search Performance
Product-led growth platform Appcues has a great internal linking structure. The graph below is generated by looking at all of the links out from the text of blog posts (not headers, footers, or sidebar links). The size of the circles is correlated with the number of incoming links that page has. The bigger it is, the more links it has.
On the Appcues site, blog posts link to each other, but they also link out to other parts of the site where readers will find value. For instance, the largest red circle is a page on in-app modals: 48 posts are linking to this page. This isn’t a generic product page. Though it is outside the blog, the page is packed with information on what modals are and best practices for use. Yes, Appcues is moving readers down the funnel, but they aren’t doing so clumsily—they are always providing value.Here is another example from product analytics platform Amplitude:
This is what a hub-and-spoke looks like in graph form. The giant circle is their Guide to Mobile Analytics. It has 86 links from other blog posts. And guess what—Amplitude is #1 for “mobile analytics.”It is regrettable to see that most articles in our dataset have zero links because internal linking works. If you want to rank well for a specific short-tail keyword, better internal linking is an easy step you can take to tell Google what you are all about.
The Median Number of Backlinks was 1
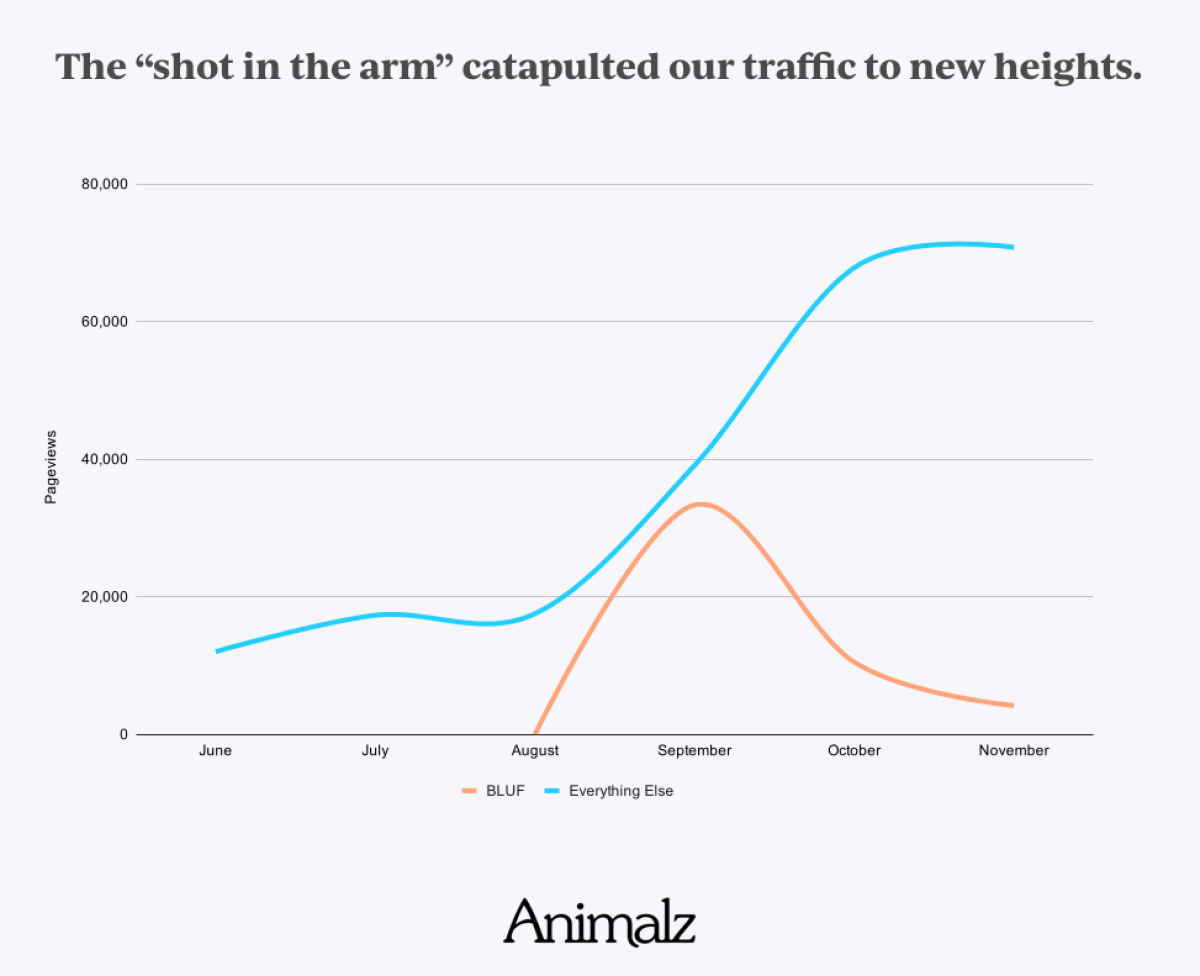
4 Most articles are getting just a single backlink from outside the blog.That’s infinitely more (literally) than the findings of Brian Dean’s study, where his dataset showed that 94% of blog posts have a measly zero external links, but still lower than we were anticipating.Anecdotally, we know that backlinks have a huge impact on overall content performance. We’ve had customers report step changes in key metrics—organic traffic, keyword rankings, and, yes, even more backlinks—triggered by the acquisition of a single link from a relevant website with high domain authority.In fact, we have our own example to share. When BLUF: The Military Standard That Can Make Your Writing More Powerful went viral on Hacker News, the ensuing deluge of 120 referring domains triggered a permanent step change in our website traffic. The blog grew by 30,000 pageviews that month—growth that we’ve sustained and built on every month since.
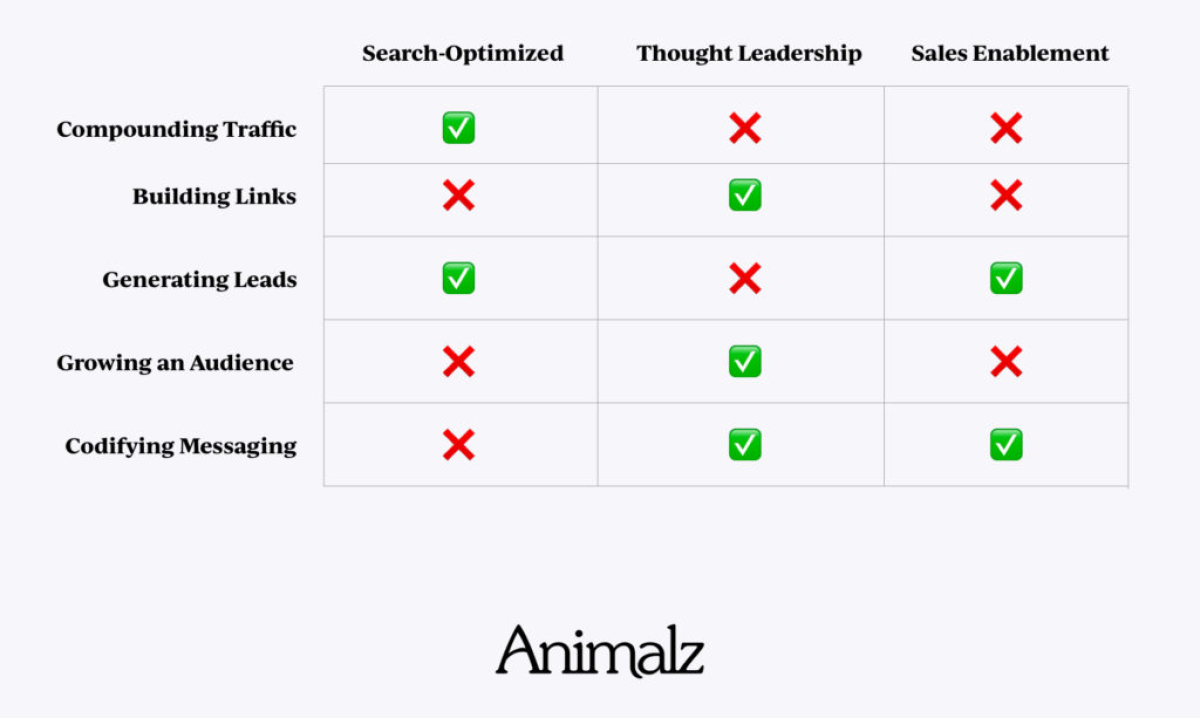
The importance of backlinks is echoed throughout content and SEO. In SparkToro’s survey of 1,584 SEO professionals, “quality of linking sites & pages” was regarded as the second-most important ranking factor, beaten only by “relevance of overall page content.”Links matter, and yet… articles are lucky to ever receive more than a single link.Based on the overwhelming dominance of organic search as a traffic source, one possible explanation springs to light: the type of content that generates the most traffic is different from the content that builds the most links. Our data revealed that “how-to” articles contribute the lion’s share of organic traffic. The situational usefulness of this content means that there’s little incentive to share it on social media or reference it in blog posts.In short: the type of content that drives traffic is different than the type of content that builds links. The best blogs take a portfolio approach to content marketing, deploying different types of content to achieve different objectives.
The mean number of backlinks was 7.74, suggesting that while most articles get zero-to-few links, a minority of articles are getting a far larger number of backlinks and skewing the average. The takeaway here is simple: dedicate resources to backlink-generating content. Identify the types of content that generate the most links, and re-create their success.
Follow-up Questions
Is there an optimal number of links to a hub?
Is there a difference between intentional hub-and-spokes and de facto hub-and-spokes?
What is the threshold number of backlinks to trigger a “shot in the arm?”
🧐 What’s Next?
Every good research process reveals more questions than answers. The benchmarks and outliers surfaced in this report have already changed how the Animalz team thinks about content marketing, but really, we’re just getting started.In the coming months, we’ll be digging into another research report using these data points as our foundation.
We expect some of these data points to change (how will COVID-19 continue to affect content marketing?). We have new questions that need answering (is there a tipping point where links and search traffic flow more freely?). There are hard problems still to solve (like marketing attribution and conversion rates), and we’re keen to introduce more qualitative data to help contextualize the quantitative.If you’d like to be the first to receive each new research report as it is released—or you have questions you’d like us to answer—sign up for our newsletter and let us know. And thanks for reading!